The example I chose to dive into first is last year’s University of Texas Star quarterback, Quinn Ewers. Ewers, who was drafted by the Miami Dolphins of the NFL, was a record-breaker in college. He currently holds the single-season program record for passing yardage and touchdowns at the University of Texas, and has led his team to a Big 12 Championship as well as a College Football Playoff appearance (Texas’ first since 2009).

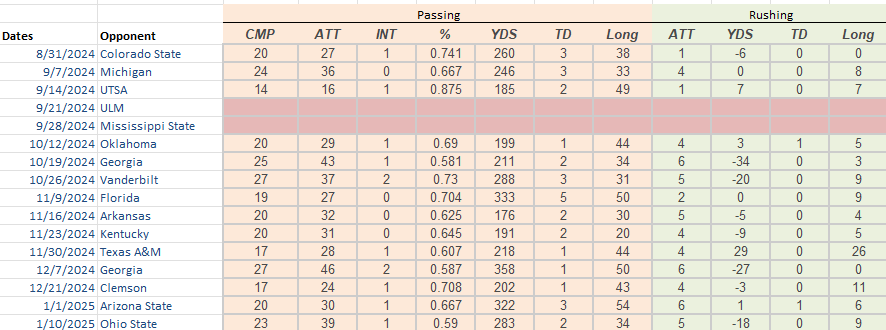
Please see Ewers’ 2024 season stats below:
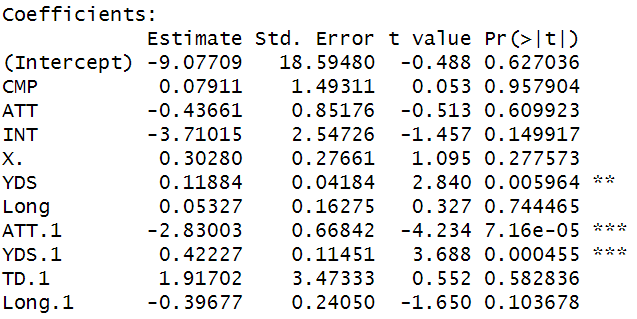
In order to effectively model how much value a quarterback brings to his team, we first have to determine which QB stats have the largest contribution to a team’s success. One feasible method to go about this is through multiple regression, in which multiple explanatory variables are modeled against one response variable to determine how much weight each explanatory variable holds in predicting the response variable, and how statistically significant each weight is. To start, we can treat all QB box scores as explanatory variables and treat the score differential (Team Score – Opponent Score) as the response variable:
After going through the first pass of this process, we can see that many of the QB box score stats are not actually statistically relevant to the performance of the team. We can run the regression again after removing those variables:
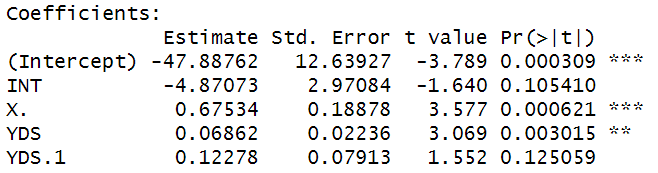
After this, we see that a reasonable equation to predict the team’s results based on the quarterback’s performance is:

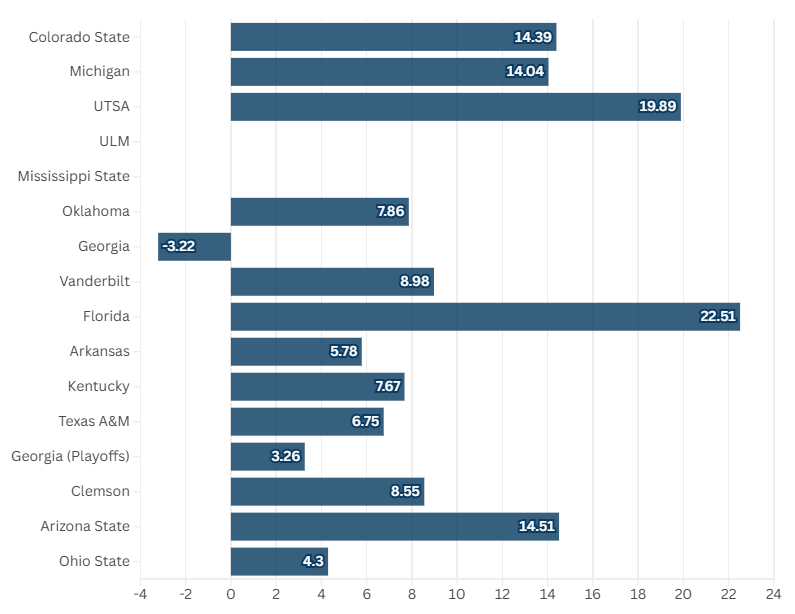
Applying this equation to all of Ewers’ starts last season:
We now have a way to isolate and quantify the quality of a QB’s performance by game. However, not all games in college football are the same. Whether it is the strength of the opponent or the implications behind the game, every game has a different level of importance. The two most important factors in determining this is in-person attendance and TV viewership – this will account for conference and playoff factors (more people pay attention to more important games, which gains recognition for the program). For this purpose, I weighted the in person attendance and 20% and TV viewership at 80%.
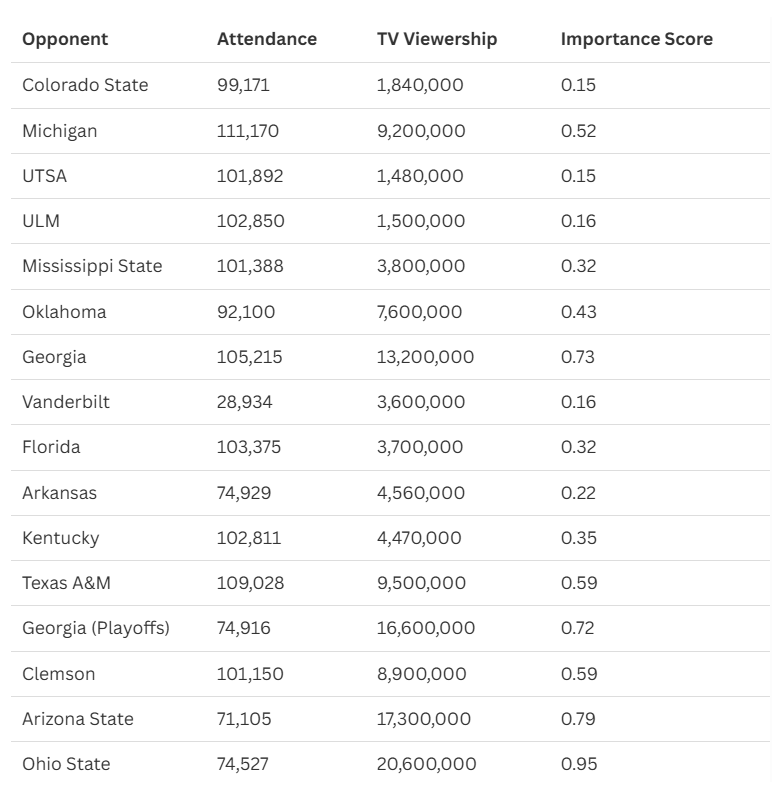
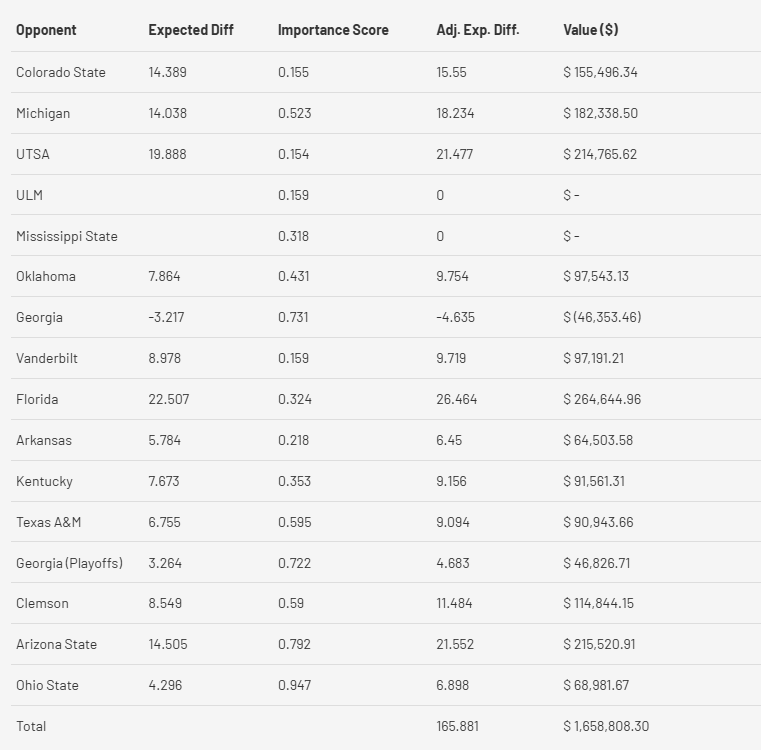
We can use this “importance score” as an exponential multiplier to the expected point differential (so that more important games have magnified performances). We also want to assign a dollar value to every point that the player generates, which in this case can be assumed as $10,000:
In addition to calculating the performance value of a quarterback, we also have to consider the social exposure that a player brings to the team. One way to do this is to assign a marginal value to every social media follower on every platform:
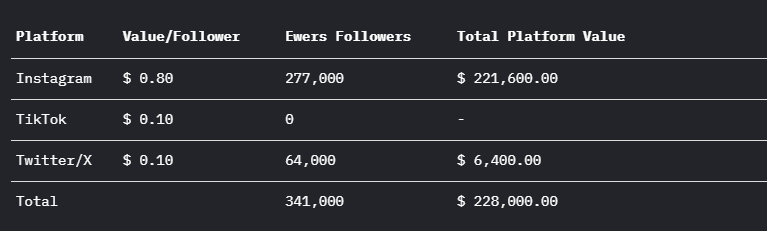
In summary:

There is a lot of room for future development in this model, such as:
- Financial/Cash flow correlation
- Value as % of team salary cap
- High school performance evaluation
- Transfer portal
